The Hidden Cost of Running Operations Across Multiple Vendors

14 Sep, 2026

Article Summary

  • Coordination cost does not scale with the number of vendors. It scales with the number of interdependent pairs between them, which grows roughly as n(n−1)/2. Six vendors create fifteen coordination relationships, not six.
  • Half of the 1,000+ decision-makers Quickbase surveyed waste more than ten hours a week chasing information across people and systems (Quickbase, 2023). At a fully loaded mid-market rate, that recurring drag runs into tens of thousands of dollars a year before a single vendor invoice is paid.
  • 70% of executives say their vendor management function is not fully mature (Deloitte Global Outsourcing Survey, 2024). Most companies are absorbing multi-vendor cost without the function that would let them see it.
  • The accountability gap has a mechanism rather than a villain. Vendors define uptime, severity and scope differently in their own contracts, so their incident timelines genuinely disagree, and the hours spent establishing whose fault it was are billed to you in downtime.
  • Multiple vendors are the correct answer more often than consolidation vendors admit. The cost that matters is not vendor count but coordination density, and consolidating past the point where you could credibly leave a partner trades one cost for a worse one.

The Hidden Cost of Running Operations Across Multiple Vendors thumbnail

Article Summary

  • Coordination cost does not scale with the number of vendors. It scales with the number of interdependent pairs between them, which grows roughly as n(n−1)/2. Six vendors create fifteen coordination relationships, not six.
  • Half of the 1,000+ decision-makers Quickbase surveyed waste more than ten hours a week chasing information across people and systems (Quickbase, 2023). At a fully loaded mid-market rate, that recurring drag runs into tens of thousands of dollars a year before a single vendor invoice is paid.
  • 70% of executives say their vendor management function is not fully mature (Deloitte Global Outsourcing Survey, 2024). Most companies are absorbing multi-vendor cost without the function that would let them see it.
  • The accountability gap has a mechanism rather than a villain. Vendors define uptime, severity and scope differently in their own contracts, so their incident timelines genuinely disagree, and the hours spent establishing whose fault it was are billed to you in downtime.
  • Multiple vendors are the correct answer more often than consolidation vendors admit. The cost that matters is not vendor count but coordination density, and consolidating past the point where you could credibly leave a partner trades one cost for a worse one.

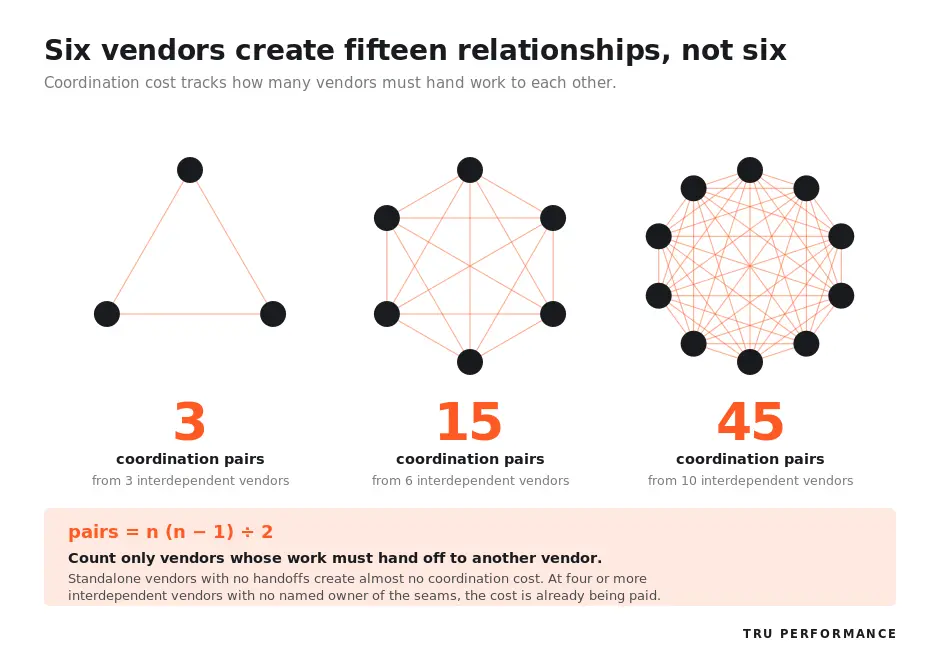
Six vendors create 15 coordination pairs, showing how vendor relationships increase coordination costs.

Nothing shipped last Thursday. The campaign was scheduled, the data was supposed to be ready, the landing page was supposed to be live. Three vendors are on the call. The analytics partner says the data was delivered on time. The development partner says the specification changed. The agency says the specification never changed. Everyone is telling the truth as their own records show it, and none of the records agree.

Two hours later, the meeting has produced no cause and no owner. Someone internal will now spend a day reconstructing the sequence from Slack threads and email timestamps. That day is the cost. Not the vendor invoices, which are all reasonable and all approved. The cost is the internal work of making several vendors behave like one operation.

That work rarely appears in a budget line, which is why it grows unchecked.

The moment the cost becomes visible

The hidden cost of running operations across multiple vendors is the internal coordination, reconciliation and arbitration work required to make separately-contracted vendors function as a single operation. It is paid in staff hours rather than invoices, which is why it stays off the budget until someone measures it.

Most companies never measure it. Deloitte’s 2024 Global Outsourcing Survey, covering more than 500 executives globally, found that 70% say their Vendor Management Office function is not fully mature. The discipline that would surface this cost is itself underbuilt in seven of ten organizations, so the cost accumulates in the one place nobody reports on: the calendars of the people holding it together.

Procurement is not being handed slack to fix this either. The Hackett Group’s 2026 Procurement Key Issues Study found procurement workloads rising roughly 8% in 2026 while headcount and operating budgets decline. More vendors, more contracts, fewer people to manage them.

Why vendor timelines genuinely disagree

The instinct is to read the finger-pointing meeting as vendors dodging blame. Sometimes it is. More often there is a structural reason the accounts do not reconcile, and understanding it changes what you do about it.

Each vendor operates against its own contract, and those contracts define the same words differently:

  • “Down” is not one definition. One vendor’s SLA measures availability at the service endpoint. Another measures it at the application layer. A degraded service that never fully stopped is an outage in one contract and normal operation in another.
  • Severity thresholds differ. What triggers a Sev-1 incident review at one vendor is a routine ticket at another, so the two produce documentation of completely different depth for the same event.
  • Uptime data is self-reported. Each vendor reports on its own instrumentation, measuring its own scope. Nobody is measuring the seams between them, and the seams are where multi-vendor operations actually fail.
  • Scope boundaries are drawn by contract, not by workflow. Work flows across vendor boundaries. Accountability stops at them.

The result is three internally consistent accounts that cannot be reconciled, and no independent record because no vendor was contracted to keep one.

The bill for that arrives as time. ITIC’s 2024 Hourly Cost of Downtime Survey of more than 1,000 firms worldwide found that the average cost of a single hour of downtime exceeds $300,000 for over 90% of mid-size and large enterprises. Every hour spent determining whose system failed is an hour not spent restoring it. In a single-vendor incident that determination takes minutes. Across four vendors it can take most of a day.

What multi-vendor operations actually costs, line by line

Most content on this subject asserts that vendor sprawl is expensive and never itemizes it. Below is a model. Each line is labeled by evidence quality, because the honest position is that some of these have published benchmarks behind them and some can only be modeled.

The worked example is a company at roughly $50M revenue running six interdependent operations vendors, with coordination spread across four internal people. Fully loaded internal rate is assumed at $69 per hour (a $110,000 salary plus 30% loading, over 2,080 hours). Substitute your own rate.

Cost line Evidence quality Annual estimate Basis
Recurring coordination (status calls, async chasing, context relay between vendors) 🟢 Benchmark-supported ~$43,000 13.5 hrs/week across the team over 46 working weeks. Consistent with Quickbase’s finding that half of respondents lose 10+ hrs/week chasing information across people and systems.
Meeting load specific to vendor governance 🟢 Benchmark-supported ~$18,000 Asana’s 2024 research puts managers at 5.8 hrs/week and executives at 5.3 hrs/week in unnecessary meetings. Attributing a conservative one-third of that to vendor governance across two managers.
Reporting reconciliation (normalizing six report formats into one view) 🟡 Modeled ~$3,300 4 hrs/month of analyst time. No published benchmark isolates this from general coordination time.
Rework at handoffs (deliverables returned because the brief crossed a vendor boundary) 🔴 Modeled only ~$12,000 Assumes 8% of cross-vendor deliverables need a rework cycle. No published benchmark exists for this line at all. Treat as directional.
Duplicate tooling and licenses 🟡 Benchmark-adjacent Varies Zylo’s 2026 SaaS Management Index puts the average organization at 305 SaaS applications, with business units controlling 81% of SaaS spend against 15% managed by IT. Duplication is well evidenced for software; no equivalent data exists for duplicated services.
Security and compliance review per vendor 🟡 Modeled ~$15,000 Six vendors reviewed annually. Scales linearly with vendor count and is the one line that is genuinely unavoidable.
Contract and renewal administration 🟡 Modeled ~$9,000 Six renewal cycles, each with review, negotiation and legal time.
Incident arbitration 🟢 Benchmark-supported (cost per hour), 🔴 modeled (frequency) Highly variable ITIC’s $300K+/hour downtime figure is solid. How often you have a multi-vendor incident is company-specific. Two contested incidents a year at four hours each is not unusual.
Indicative subtotal, excluding tooling and incidents ~$100,000 Roughly two-thirds of a mid-level operations hire, spent on coordination rather than output.

Two honest caveats on that number. It excludes the two largest and most variable lines, so it understates rather than overstates. The rework figure is also the weakest line in the table, resting on an assumption rather than published data, which is worth saying plainly rather than burying.

The point of the exercise is the knowability, rather than the total itself. Nearly every company carrying this cost has never once calculated it.

How many vendors is too many

Every source that addresses this question answers that there is no benchmark, which is true and useless. A better framework exists, and it starts by rejecting vendor count as the unit of measurement.

Coordination cost is not driven by how many vendors you have. It is driven by how many of them have to work with each other. A payroll provider and a creative studio that never exchange anything create no coordination cost between them. Two vendors whose work has to hand off weekly create a great deal.

The relationship is not linear. For vendors that are genuinely interdependent, the number of coordination relationships grows as n(n−1)/2:

Interdependent vendors Coordination pairs What it feels like
2 1 One relationship to manage. Direct.
3 3 Manageable. Everyone still knows the whole picture.
4 6 Coordination becomes a named part of someone’s job.
6 15 Nobody holds the full picture. Status meetings multiply.
8 28 An internal coordination layer exists whether or not it is staffed.
10 45 The coordination work exceeds the capacity of anyone doing it part-time.

Vendor count doubles from four to eight. Coordination relationships increase more than fourfold. That gap is the entire phenomenon.

The practical test. Count only vendors whose work must hand off to another vendor. Ignore the standalone ones, however many there are. If your interdependent count is at four or above and no single named person owns the seams between them, you are already paying the cost in the table above and are simply not seeing it on a report.

The honest case for keeping multiple vendors

A piece arguing that vendor sprawl is expensive should be straight about when it is worth paying for, otherwise it is a sales pitch with footnotes.

Multiple vendors are the right structure when:

  • The work is genuinely specialized and does not interconnect. A patent firm, a payroll provider and a brand studio have no seams to manage. Consolidating them buys nothing.
  • You need negotiating leverage. A credible alternative supplier is what keeps pricing honest. Losing it has a cost that never appears as a line item.
  • Concentration risk is real. One partner failing should not stop the whole operation. This is a legitimate reason to accept coordination cost as insurance.
  • Best-in-class capability materially outperforms. In a category where the top specialist is meaningfully better and that gap drives revenue, paying the coordination tax is rational.

What is not a good reason: inertia. A large share of vendor sprawl is the residue of decisions that each made sense on their own day, accumulated without anyone reviewing the set as a whole.

What a single accountable partner changes

Consolidating interdependent work under one accountable partner does not simply reduce a vendor count. Three things change structurally.

  • The seams move inside. Handoffs that were contract boundaries become internal handoffs for the partner. The coordination work does not vanish. It stops being your staff’s second job.
  • Accountability stops being contested. The finger-pointing meeting cannot happen with one accountable party. Attribution of a failure becomes a fact rather than a negotiation, which removes the arbitration hours entirely.
  • Reporting arrives normalized. One reporting standard across the scope replaces the monthly work of reconciling several formats into a view leadership can read.

This is the structure Tru Performance runs. As a business growth and operations partner working across 250+ brands and more than $500M in client revenue, we operate scope as one accountable layer rather than several coordinated ones, through ConvergeOS™, our operating model with five stages: Diagnose, Design, Deploy, Operate and Compound. Diagnose is where the coordination map above gets built for a specific business, because the honest answer is sometimes that a company’s vendors are not interdependent enough for consolidation to pay.

The evaluation criteria for a partner taking on that kind of scope are covered separately in what to look for in an operations partner.

The consolidation trap worth avoiding

There is a real counter-argument to everything above, and ignoring it would be dishonest.

Consolidation buys simplicity by spending optionality. Once a single partner runs enough interdependent scope, leaving becomes expensive and slow, and a partner who knows you cannot credibly leave prices accordingly. The saving shows up in year one and can quietly reverse by year three.

The discipline that prevents it is straightforward, and it belongs in the contract rather than the relationship:

  1. Keep the exit real. Documented runbooks, your data in your systems, and defined transition assistance. A partner unwilling to write transition terms is telling you something.
  2. Consolidate the seams, not the market. Bring together work that has to hand off. Leave genuinely standalone categories alone.
  3. Contract to outcomes. Measure the partner on results rather than hours or headcount supplied, so the relationship stays about performance.
  4. Stage it. Move one interdependent cluster first. Verify the coordination cost actually fell before moving more.
  5. Reprice on evidence. Review annually against a real market benchmark, not against last year’s invoice.

The goal is one accountable partner you continue to choose, rather than one you can no longer leave. Consolidation done for simplicity alone tends to produce the second. Consolidation done to close specific, measured seams produces the first.

Source

All figures verified at the primary research organization’s own published page.

Claim Source Year URL
70% of executives say their Vendor Management Office function is not fully mature; n=500+ executives globally Deloitte Global Outsourcing Survey 2024 View source
Half of respondents waste more than 10 hrs/week chasing information from different people and systems; n=1,000+ decision-makers Quickbase research report 2023 View source
Managers lose 5.8 hrs/week to unnecessary meetings (up 87% since 2019); executives 5.3 hrs/week (up 51%) Asana, State of Work Innovation 2024 View source
Average cost of one hour of downtime exceeds $300,000 for over 90% of mid-size and large enterprises; n=1,000+ firms worldwide ITIC Hourly Cost of Downtime Report 2024 View source
Average organization manages 305 SaaS applications; business units control 81% of SaaS spend vs 15% managed by IT Zylo SaaS Management Index 2026 View source
Procurement workloads rising ~8% in 2026 while headcount and operating budgets decline The Hackett Group, Procurement Key Issues Study 2026 View source

Rejected during verification (do not reinstate):

  • “68% of technology leaders plan to consolidate their vendor landscape” and “targeting a 20% reduction” — cited widely to ADAPT CIO Edge research via SAP News, but SAP’s citation links to an unrelated third-party blog, and ADAPT’s own published figure is 70%, not 68%, and is Australia/NZ-specific rather than global. Broken citation chain.
  • “87% of applications are bought outside IT” (Zylo) — does not appear in the 2026 edition. Replaced with the current spend-based figure (81% of SaaS spend controlled by business units).
  • “94% of IT executives say manual SaaS management leads to poor spend decisions” — traced to 2022 Productiv data being re-dated as 2025 in competitor content. Stale and laundered.

Modeled figures disclosure: The coordination, reconciliation, rework, compliance-review and contract-administration lines in §3 are models built on the stated assumptions, not published benchmarks. They are labeled as such in the table. The rework line in particular rests on an 8% assumption with no published benchmark behind it and should be presented as directional.

Denver Mascarenhas

Vice President, Growth and Innovation, Tru Performance

A performance marketing and RevOps leader with 15+ years building global marketing teams and the AI-powered growth and product-innovation programs that turn client marketing into measurable outcomes.

Frequently Asked Questions

Everything you need to know about the product and billing.

For a mid-market company running six interdependent operations vendors, the internal coordination cost typically runs near $100,000 a year before tooling duplication and incident arbitration are counted. The largest components are recurring coordination and vendor governance meetings, which together account for roughly $60,000 at a fully loaded internal rate of $69 an hour. Quickbase’s 2023 research found half of over 1,000 decision-makers waste more than ten hours a week chasing information across people and systems, which is the behavior this cost is made of.

Vendor count is the wrong measure. Count only vendors whose work must hand off to another vendor, because coordination relationships grow as n(n−1)/2. Three interdependent vendors create three relationships; six create fifteen; ten create forty-five. If your interdependent count is four or higher and no single named person owns the seams between them, the coordination cost is already being paid by staff whose job description does not mention it.

Usually because their accounts genuinely differ rather than because anyone is being evasive. Each vendor works to its own contract, and those contracts define availability, severity thresholds and scope boundaries differently. Uptime data is self-reported against each vendor’s own instrumentation, and nobody is measuring the seams between vendors, which is exactly where multi-vendor operations fail. Without an independent incident record, three truthful accounts can still fail to reconcile.

It saves coordination cost, which for interdependent vendors is the largest hidden cost. It can also spend negotiating leverage, and a partner who knows you cannot credibly leave will price accordingly over time. The saving is real when consolidation closes specific measured seams and the contract preserves a genuine exit through documented runbooks, client-owned data and defined transition assistance. The saving tends to reverse when consolidation is pursued for simplicity alone.

The accountability gap is the space between vendor contracts where work flows but responsibility does not. Each vendor is accountable for its own scope, nobody is accountable for the handoff, and failures that occur at a boundary have no owner. Closing it requires either an independent record of what happened across all vendors, or a single partner accountable for the whole scope including the seams.

Keep multiple vendors when the work is genuinely specialized and does not interconnect, when concentration risk would be unacceptable, when maintaining a credible alternative supplier is needed for pricing leverage, or when a best-in-class specialist materially outperforms in a category that drives revenue. Standalone vendors with no handoffs to other vendors create almost no coordination cost, so consolidating them buys very little.

Vendor management is the ongoing discipline of contracting, monitoring, reviewing and governing suppliers, whichever number you have. Vendor consolidation is a one-time structural decision to reduce that number. Deloitte’s 2024 Global Outsourcing Survey found 70% of executives say their vendor management function is not fully mature, which means most companies considering consolidation are making a structural decision without the ongoing discipline that would tell them whether it is the right one.

Still Have Questions?

Can’t find the answer you’re looking for? Let’s collaborate and unlock your Tru potential.

Trends That Drive Innovation

11 Min read Marketing

The Hidden Cost of Running Operations Across Multiple Vendors

Nothing shipped last Thursday. The campaign was scheduled, the data was supposed to be ready, the landing page was supposed to be live. Three vendors are on the call. The analytics partner says the data was delivered on time. The development partner says the specification changed. The agency says the specification never changed. Everyone is […]

12 Min read Marketing

Building a B2B Attribution Model Your CFO Will Trust

Your attribution report says marketing sourced $4.2M in pipeline last quarter. Finance’s report says marketing sourced $1.6M. Both numbers were pulled from the same CRM on the same day. Neither team can explain the gap in the meeting, so the meeting ends the way these meetings usually end, with the CFO deciding to treat the […]

7 Min read AI

AI Marketing Ops vs. Traditional Ops: What Actually Changes

The category confusion The phrase “AI marketing ops” has gotten loose in 2026. Vendors use it to describe any marketing platform that has an AI feature button. Agencies use it to describe everything from prompt engineering to a full RevOps rebuild. CMOs use it interchangeably with “AI in marketing,” “marketing automation 2.0,” and “RevOps with AI.”  This guide […]

7 Min read AI

What to Look for in an AI Marketing Operations Partner

Why this evaluation matters more in 2026 Choosing the wrong AI marketing ops partner in 2026 doesn’t just waste a quarter it puts you in the 88% of AI proofs of concept that never reach production (IDC, 2026) and the 95% of enterprise AI pilots that fail to deliver ROI (MIT Project NANDA, 2025). The […]